• Describe management’s role in agribusiness
• Provide an overview of the functional responsibilities of management
• Describe the unique characteristics of the food and agribusiness industries
• Describe the size, scope, and importance of the food production and marketing system
• Understand the farm-food marketing bill and what it means to producers and consumers
• Provide an overview of the food sector, the production agriculture sector, and the input supply sector
• Outline trends in home and away-from-home food consumption, and trends among the types of firms that serve these markets
• Explore the production agriculture sector, and some of the key changes occurring on U.S. farms
• Outline the major inputs used by the production agriculture sector and key trends in input use
• Understand the types of firms involved in producing and distributing inputs to production agriculture
It is exciting and diverse. It is changing quickly. It relies on the weather, uses an incredible array of technology, is tied in every way to our natural resources, and embraces the world. If you eat, you are involved in it as a consumer of its final products. If you farm, you are involved in it as a producer of the raw materials that ultimately make their way to the end consumer. It is the extremely efficient, very complex, global, food and fiber production and marketing system.
This system is vast and it is fascinating: the next time you walk through your local grocery store, think about the number and type of diverse activities involved in growing, harvesting, transporting, processing, and distributing food throughout the 50 states in the United States, and, more broadly, our world. The process by which a 260-pound hog moves from Carroll County, Indiana to a suburban superstore in Los Angeles (now in the form of a hot dog in a pre-packaged children’s meal) is very complex, yet it occurs every day in the food production and marketing system.
This food production and marketing system is made up of thousands of businesses, ranging from the small cow-calf producer in western Kentucky to some of the largest corporations in the world. And, it is management that drives and directs the firms, farms, and food companies that come together in the food production and marketing system. A retail supermarket, a major corn processor, the local farm supply store and a family farmer each have a person or a group of people responsible for making sure that things get done. These are the managers. Their titles range from chief executive officer to president to foreman to son or daughter or spouse. However, wherever they are found within an organization, managers are responsible for assuring successful completion of the functions, tasks, and activities that will determine an organization’s success.
This book, Agribusiness Management, focuses on the management of food, fiber, and agribusiness firms. We will take a careful look at food and agricultural business management and our definition of food and agricultural businesses is quite broad. So, when we use the term agribusiness management in the text, remember that we are talking about the management of any firm involved in the food and fiber production and marketing system. Our discussion of agribusiness management in this book provides information, concepts, processes, ideas, and experiences that can contribute to your effectiveness in performing the functions and tasks of agribusiness management.
This chapter will first introduce you to the key functions of agribusiness management. Then, we will explore some of the characteristics that make the food and agribusiness markets unique places to practice the art and science of management. The ever-changing food and agribusiness industries are then discussed. We will look at firms that (1) move final products through the food and fiber system to the ultimate consumer; (2) transform raw agricultural products into the final products desired by consumers; (3) produce raw food and fiber products; and (4) supply inputs to the farm or production sector.
As you can imagine, the responsibilities of managers in agribusiness are highly varied and can range from ordering inputs for the year ahead, to hiring and firing individuals, to making the decision to sell a multi-billion-dollar international subsidiary. A chief executive officer, for instance, is responsible for the overall activities of a large, diversified food or agribusiness firm. In such firms, teams of managers are likely responsible for specialized areas within the firm. On a smaller farm business, one individual may assume roles ranging from chief executive officer, to manager, to laborer, managing multiple projects at different levels simultaneously.
To better understand the form and process by which managers perform the tasks that are required to create and sustain a viable business, the practice of management can be broken down into four key functions:
• Marketing management
• Financial management
• Supply chain management
• Human resource management
Ultimately, no matter how large or small the firm, managers have responsibilities in each of these areas. These four functions of management are explored in some detail in this book. However, it is important to have a basic understanding of each area as we develop our understanding of agribusiness management.
Marketing, in a broad sense, is focused on the process by which products flow through the U.S. food system from producer to final consumer. It involves the physical and economic activities performed in moving products from the initial producer through intermediaries to the final consumer. Marketing management involves understanding customer needs and effectively positioning and selling products and services in the marketplace. In agribusiness, marketing management is a key function within each of the sectors of agribusiness: the food sector, the production agriculture sector, and the input supply sector. Marketing management represents an integration of several different activities: selling, advertising, web page design, promotions, marketing research, new product development, customer service, and pricing—all focused on customer needs, wants, and, ultimately, the quest for customer satisfaction.
It is this function of management that is most closely focused on the end-user, or the consumer/customer of the product or service produced. It is often argued that without satisfied customers effectively reached through marketing and sales, no business could successfully operate. Thus, marketing management plays a fundamentally important role in most food and agribusiness firms. Marketing management is focused on careful and planned execution of how, why, where, when and who sells a product or service and to whom it is sold. Decisions here include what products to produce, what services to offer, what information to provide, what price to charge, how to promote the product, and how to distribute the product.
This management function is closely tied to the customer’s decision processes, and buyers differ widely in the food production marketing system. Customers range from teenagers purchasing snack foods from a food manufacturing firm, to a soybean processor purchasing soybeans from a farmer, to a large, integrated swine business purchasing vaccines from an animal health firm.
Profit is the driver for agribusinesses as they work to generate the greatest possible returns from their resources. Successful achievement of this objective means making good decisions, and it means carefully managing the financial resources of the firm. Financial management is involved in these areas and includes generating the data needed to make good decisions, using the tools of finance to make effective decisions, and managing the assets, liabilities, and owner’s investment in the firm.
Financial information allows managers to understand the current “health” of the firm as well as to determine what actions the business might take to improve or grow. Balance sheets and income statements can provide a wealth of information useful in making decisions. Financial analysis provides agribusiness managers with insights on which to better base decisions. The tools of finance such as budgeting, ratio analysis, financial forecasting, and breakeven analysis can be used by agribusiness managers to develop long-range plans and make short-run operating decisions.
Another way in which the financial agribusiness scene continues to change is in the sourcing of funds. Agribusiness firms are increasingly accessing larger amounts of funds or money from national and international capital and financial markets. To be competitive in those markets, firms must generate rates of return comparable to other industries. In the past, small agribusiness companies may have been allowed by local lenders to exhibit only modest financial performance. Today, the national and international financial markets expect performance in agriculture comparable to that in other industries if they are going to provide the agribusiness sector the funding needed for expansion, growth, consolidation, technological advancement, and modernization.
The sheer amounts of funds needed to finance future operations of a company will continue to increase dramatically. So will the need for managers who understand the tools and techniques used to source and manage those funds. For most agribusinesses, financial management will be a critical component of agribusiness management.
New technologies and concepts are rapidly hitting the workplace. This, in turn, changes the way agribusinesses do what they do. The push for quality, the drive for lower costs, changes in the supply chain, and general pressures to be more efficient in meeting consumer demands are swiftly altering the production and distribution activities of agribusiness. Supply chain management focuses on these areas and provides the tools managers need to meet these operations and logistical challenges. As a result, supply chain management has come to the forefront as a key management function for the agribusiness manager.
Operations management focuses on the direction and the control of the processes used to produce the goods and services that we buy and use each day. It involves several interrelated, interacting systems. Operations management involves the strategic use and movement of resources. For instance, a snack food factory begins its process with corn from a food-grade corn producer and ends with tortilla chips, corn chips, crackers, etc. Managers must worry about issues of scheduling, controlling, storing, and shipping as the corn moves from the producer’s truck to the supermarket.
Logistics management involves the set of activities around storing and transporting goods and services. Shipping and inventory costs are huge costs of doing business for many food and agribusiness firms. The logistics management function is focused on new ways to lower these costs, by finding better ways to ship and store product. Given advances in information technology, the analytical tools of supply chain management, and improved shipping technologies, this has been a dynamic area for food and agribusiness firms. In addition, the growth of global markets depends upon the performance of well-managed supply chains.
Successful agribusinesses are those who consistently produce faster, better, and cheaper. The management of logistics in food and agricultural supply chains will become increasingly focused on building such time-based advantage. Quicker response to consumer needs, faster delivery times, shorter product development cycles, and more rapid recovery after service problems are all components of time-based advantage in supply chain management. At the same time, there is an incredible push for quality, safety, and integrity in food system production processes. Effective supply chain management will continue to be crucial in the successful execution of any strategic plan for agribusiness firms.
In the end, management is about people. Without the ability to manage the human element—the resources each business has in its employees—businesses do not succeed. When combining efficient management of the marketing/finance/supply chain functions of the business with the thoughtful management of the human side of the business, managers are on the road to successful implementation of their strategy.
Agribusiness managers who can manage people well can significantly impact both productivity and financial success. Human resources management encompasses managing two areas: the mechanics of the personnel administration, and the finer points of motivating people to offer and contribute their maximum potential. Decisions here include how to organize the firm, where to find people, how to hire them, how to compensate them, and how to evaluate them.
Today’s lean agribusiness firms continue to demand more performance from their managers, sales force, and service and support personnel. For instance, in addition to superb selling skills, sales representatives will be expected to have intimate knowledge of technology and a fundamental understanding of the general management problems of their producer customers. Service personnel must be able to maintain increasingly complex equipment. Technical support staff will need to be experts at assimilating and using the massive amount of production data that a large dairy farm or crop farm using site-specific management practices will generate.
These types of demands will require agribusinesses to hire individuals with greater initial skills and with the ability to grow into different jobs throughout the course of their careers. Agribusinesses will need to be flexible while providing continuing education and development of key skills. Some examples of such skills are general business, negotiation, problem-solving, technical, information management, and communication. Recognition of raw ability and the development and fine-tuning of these skills and abilities will be the human resource challenge. Managed well, that challenge will profitably produce for the company. And this is the role of human resource management in the food and agribusiness firm.
It may be easy to argue that management theory and principles are the same for any type of business enterprise. The largest businesses in the country, such as General Electric and Walmart, and the smallest one-person agribusiness are guided by many of the same general principles. In many cases, good management is good management, regardless of the type of firm, or the market it is operating in.
Yet key differences between large and small businesses or between agribusinesses and other types of firms arise in the specific business environment facing the organization. While there are similarities, the markets facing General Electric’s wide range of businesses differ substantially. The automotive industry is different from the retail industry. Likewise, the unique characteristics of the food production and marketing system cause management practices to differ for agribusiness firms. Our job is to better understand the similarities and differences in the functions and tasks of a food and agribusiness manager compared to other managers.
As a professional, the manager might be compared to a physician. The knowledge and principles of medicine are the same, but patients differ in such vital details as age, gender, body mass index, and general health. The physician’s skill is to apply general medical principles to the specific individual to create the optimal outcome for the patient given the unique set of circumstances at hand. The manager, utilizing specific tools of marketing management, financial management, supply chain management, and human resource management, must attempt to solve the problem at hand and create the best outcome for the firm—long-term profitability.
Food and agribusiness markets differ from other markets in at least eight key ways, influencing the business situation that food and agribusiness managers must practice. While one can find examples of other industries in which each point is important (for example, seasonality is important to toy companies), in combination these factors form the distinguishing features of the food and agribusiness marketplace.
Food as a product. Food is vital to the survival and health of every individual. Food is one of the most fundamental needs of humans, and provides the foundation for economic development—nations first worry about feeding their people before turning their attention to higher order needs. For these reasons, food is considered a critical component of national security. As a result, the food system attracts attention from governments in ways other industries do not.
Biological nature of production agriculture. Both crops and livestock are biological organisms—living things. The biological nature of crops and livestock makes them particularly susceptible to forces beyond human control. The variances and extremes of weather, pests, disease, and weeds exemplify factors that greatly impact production. These factors affecting crop and livestock production require careful management. Yet, in many cases, little can be done to affect them outright. The gestation cycle of a sow or the climate requirements of wine grapes provide examples.
Seasonal nature of business. Partly as a result of the biological nature of food production, firms in the food and agribusiness markets can face highly seasonal business situations. Sometimes this seasonality is supply driven—massive amounts of corn and soybeans are harvested in the fall. Sometimes this seasonality is demand driven—the market for ice cream has a series of seasonal peaks and valleys, as do the markets for turkey and cranberries. Such ebbs and flows in supply and demand create special problems for food and agribusiness managers.
Uncertainty of the weather. Food and agribusiness firms must deal with the vagaries of nature. Drought, flood, insects, and disease are a constant threat for most agribusinesses. All market participants, from the banker to the crop production chemical manufacturer are concerned with the weather. A late spring can create massive logistical problems for firms supplying inputs to the crop sector. Bad weather around a key holiday period can ruin a food retailer’s well-planned promotional event.
Types of firms. There is tremendous variety across the types of businesses in the food and agribusiness sectors. From farmers to transportation firms, brokers, wholesalers, processors, manufacturers, storage firms, mining firms, financial institutions, retailers, food chains and restaurants—the list is almost endless. Following a loaf of bread from the time it is seed wheat prepared for shipment to the farmer until its placement on the retail grocer’s shelf involves numerous types of business enterprises. The variety in size and type of agribusinesses, ranging from giants like ConAgra to family farms, shapes the food and agribusiness environment.
Variety of market conditions. The wide range of firm types and the risk characteristics of the food and agribusiness markets have led to an equally wide range of market structures. Cotton farmers find themselves in an almost textbook case of the perfectly competitive market where individual sellers have almost no influence over price. At the same time, Coca-Cola and PepsiCo have a literal duopoly in the soft drink market. Some markets are global, others local. Some markets are characterized by near equal bargaining power between buyer and seller, while others may be dramatically out of balance in one direction or the other.
Rural ties. Many agribusiness firms are located in small towns and rural areas. As such, food and agribusiness are likely the backbone of the rural economy and have a very important role in rural economic development.
Government involvement. Due to almost every other factor raised above, the government has a fundamental role in food and agribusiness. Some government programs influence commodity prices and farm income. Others are intended to protect the health of the consumer through safe food and better nutrition information. Still other policies regulate the use of crop protection chemicals, and affect how livestock producers handle animal waste. Tariffs and quotas impact international trade. School lunch programs and the supplemental nutrition assistance program (SNAP) help shape food demand. The government, through policies and regulations, has a pervasive impact on the job of the food and agribusiness manager.
Each of these special features of the food production and marketing system affects the environment where agribusiness managers practice their craft. Agribusiness is unique and thus requires unique abilities and skills from those involved with this sector of the U.S. economy.
The highly efficient and effective food production and marketing system in the U.S. is a result of a favorable climate and geography; abundant and specialized production and logistics capabilities; intense use of mechanical, chemical, biological and information technologies; and the creative and productive individuals who lead and manage the firms which make up the food and agribusiness industries. This U.S. food production and marketing system produces enormous supplies of food and fiber products. These products not only feed and clothe U.S. consumers, but are also exported to the international marketplace to fulfill the needs of consumers around the world.
The food production and marketing system encompasses all the economic activities that support farm production and the conversion of raw farm products to consumable goods. This broad definition includes farm machinery manufacturers, fertilizer mines, baby food factories, the paper firms that supply cardboard boxes, rail and trucking firms, wholesalers, distributors, and retailers of food, restaurateurs, and many, many others.
The U.S. food production and marketing system is extremely large, directly employing over 11 million workers, generating $814 billion worth of value-added products and services in 2013 (Table 1.1). The output of this system represents 4.9 percent of the total value-added production to the Gross Domestic Product (GDP) of the U.S. economy.
Note that U.S. economic activity also includes the contributions of firms providing inputs to the farm, forestry, and fisheries sectors. In 2013, $251.7 billion of energy, materials, and purchased inputs were used by agriculture and related ventures, representing 1.5 percent of GDP (Table 1.1). In addition, the food and agribusiness sectors are key contributors to the economic activity of transportation, wholesaling, and retailing in the U.S.
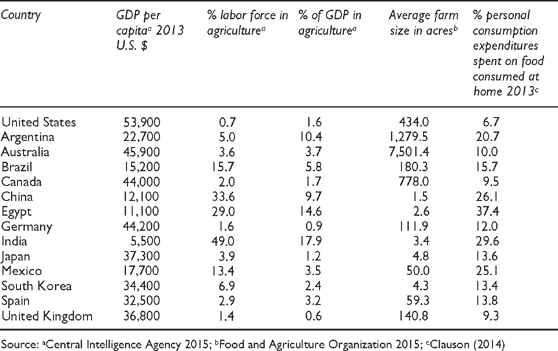
Food and agricultural systems vary widely across the globe. Countries with higher per capita GDP (over $25,000) typically have a lower proportion of their population (under 4 percent) involved in production agriculture (Table 1.2). In contrast, the characteristics of the less developed countries find a lower GDP per capita and a higher proportion of the population involved in production agriculture. In China, 34 percent of the population is involved in farming, while in India the figure is 49 percent. The continued economic growth of these countries is fueling a tremendous demand for additional inputs, as well as branded food products. As a result, many U.S. firms are attempting to establish joint ventures with firms in these countries to aid in this development process, and to build future markets in the process.
Farm size varies dramatically, even among developed countries (Table 1.2). Geography or limited farmland, climate, crop or livestock focus, or simply the area needed to maintain a viable production unit helps explain this variation. This has important implications for the types of agricultural inputs needed in different parts of the globe. A 7,500-acre wheat farmer in Australia has much different expectations and needs from equipment and technology than a Chinese farmer on his or her two-acre plot.
| Value added to GDP (billion $) |
% share of U.S. GDP |
Number of FTE workers (000) |
% share of total U.S. employment |
|
| U.S. GDP | 16,768.1 | 125,980 | ||
| Farms | 192.1 | 1.15 | 676 | 0.54 |
| Forestry, fishing, and related activities | 34.6 | 0.21 | 485 | 0.38 |
| Food and beverage and tobacco products | 235.1 | 1.40 | 1,597 | 1.27 |
| Textile mills and textile product mills | 16.8 | 0.10 | 223 | 0.18 |
| Apparel and leather and allied products | 10.4 | 0.06 | 168 | 0.13 |
| Food services and drinking places | 325.4 | 1.94 | 8,149 | 6.47 |
| Total for Food and Agricultural Industries | 814.4 | 4.86 | 11,298 | 8.97 |
| Total Inputs for Agriculture, Forestry, Fishing, and Hunting | 251.7 | 1.50 | ||
| Energy inputs | 25.3 | 0.15 | ||
| Materials inputs | 163.5 | 0.98 | ||
| Purchased inputs | 62.9 | 0.38 |
Source: U.S. Department of Commerce 2015
The overall efficiency of the U.S. food and fiber sector is illustrated by the proportion of personal consumption expenditures allocated to food consumed at home. For average U.S. consumers, less than 7 percent of their total personal consumption expenditures are for food consumed at home (Table 1.2). In Japan this figure is about 14 percent, while food accounts for over one-third of an Egyptian consumer’s personal consumption expenditures. The efficiency of the U.S. food production and marketing system is really quite remarkable. Consider this: with 8.3 percent of the world’s agricultural land and 4.4 percent of the world’s population, the U.S. food system produces 14 percent of the world’s livestock and 14 percent of the world’s crops (FAO 2015). In 2010, the U.S. produced 35 percent of the world’s soybeans, 39 percent of the corn, 16 percent of the cotton, and 9 percent of the wheat.
A primary requirement for being a successful agribusiness manager is a solid understanding of this food production and marketing system. Regardless of what specific part of the food system you work in, it is important to understand what happens to food and fiber products both before they reach your firm and after they leave your firm and head to the consumer.
An important part of understanding agribusiness comes from understanding just how and what consumers spend on food. In 2013, American consumers spent over $1 trillion on food for at-home and away-from-home consumption—up 93 percent from the $535 billion spent in 1993 (Figure 1.1). A better understanding of just what that spending is all about comes from looking at the farm-food marketing bill.
Plate 1.1 The agricultural production technologies used greatly contribute to the overall efficiency of the food sector and income spent on food
Photo courtesy of K-State Research and Extension
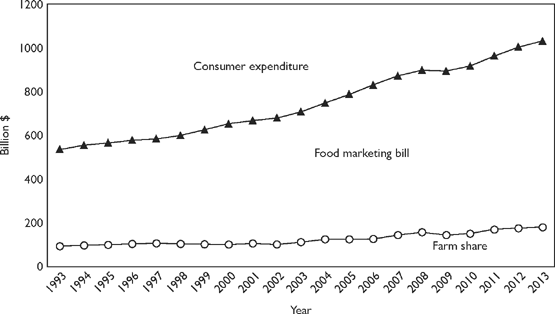
Figure 1.1 Farm share and the marketing bill for consumer food expenditures, 1993–2013
Source: Canning (2015)
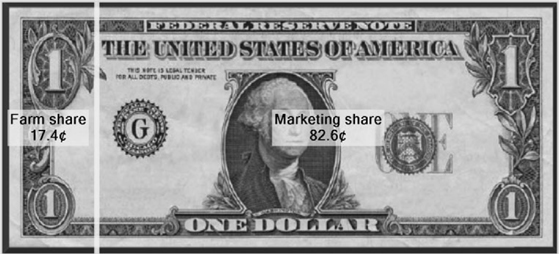
The farm-food marketing bill breaks down the proportion of the consumer’s food dollar that goes to the farmer for raw products and that goes to the food industry for “marketing” those raw farm products to end consumers (Canning, 2015). Marketing includes the value added from processing, packaging, transportation, retail trade, food services, energy, financial and insurance, and other categories to make agricultural products ready for the consumer. In 2013, for every dollar spent on food, $0.83 was spent on marketing the product, while $0.17 went to the farmer (Figure 1.2).
From 1993 to 2013, the farm share of the marketing bill rose from $94 to $180 billion, while the marketing share has increased from $441 billion to $852 billion (Figure 1.1). This long-term trend reflects continuing increases in farm productivity (which keeps farm prices relatively low), the increase in consumer demand for convenient, highly processed food products, increases in food consumed away from home, and increases in prices for many components of the marketing bill including labor, transportation, and energy. In turn, this fuels the steady widening of the food marketing bill as compared to the farm value of consumer food expenditures.
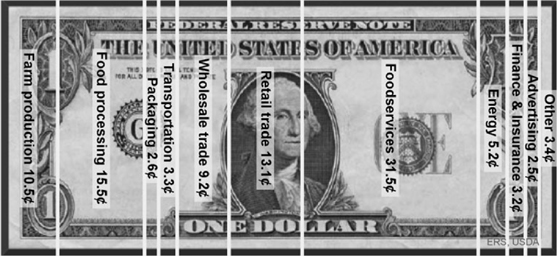
Figure 1.3 identifies the value added to the consumer food dollar in 2013 by 11 different industry sectors. The farm and agribusiness share represents 10.5 cents of each consumer food dollar, net of farm costs (Canning, 2015). The wholesale trade, retail trade, and food services sectors contribute over half of the value added to the consumer food dollar, at 9.2, 13.1, and 31.5 cents, respectively. The food-processing sector is 15.5 cents of each food dollar. The 20.2 cents for all other sectors suggests that the impact of the food and agribusiness sector as defined in Table 1.1 is undervalued. Yet without the contribution of transportation, energy, packaging, or advertising, the product would not reach the end consumer.
In the food dollar accounts, the 11 industry sectors that transform agricultural commodities to food products use four main factors of production to add value. The four are salary and benefits, property income, output taxes, and imports. At 48.6 cents per food dollar, salary and benefits comprise almost half of the food dollar (Figure 1.4). The 36.7 cents of property income represents payments for machinery, equipment, structures, natural resources, product inventory or other assets that compensate the various owners for services provided (Canning, 2015). The remainder of the 2013 food dollar is split between the U.S. government for taxes and imports or international assets.
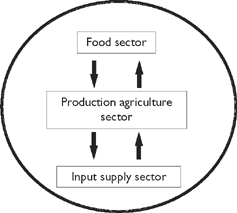
The U.S. food production and marketing system, for purposes of discussion in this text, is divided into three sectors: the food sector, the production agriculture sector, and the input supply sector (Figure 1.5).
We start with the food sector. This is the sector in which food processing, marketing, and distribution occur (Figure 1.5). Here we have firms such as Kraft, Hormel, Kroger, and McDonald’s, as well as thousands of other firms, large and small. This group closely tracks consumer tastes and preferences, adapting to meet changing needs.
Next in line is the production agriculture sector. Purchased inputs, natural resources, and managerial talent are combined to produce crop and livestock products. Agribusinesses in this sector vary in size, number, and focus—from the local grower selling strawberries to neighbors to the 100,000-head cattle feedlot; from the rice farmer in Louisiana to the canola grower in North Dakota; from the pork producer in North Carolina to the mega dairy in Arizona.
The food production and marketing system ends (or begins) with the many varied activities that take place in the input supply sector. This sector is responsible for providing the thousands of different inputs—both products and services—to production agriculture. Firms here include DuPont, Syngenta, John Deere, DeLaval, or your local cooperative, as well as hundreds of other firms that manufacture and distribute the inputs that farmers and ranchers need in their businesses. Let’s take a closer look at each of these sectors.
At some point, it all comes down to getting raw farm commodities processed, packaged, distributed, and sold to the consumer. A very wide variety of processing and marketing firms are responsible for adding value or utility to commodities as they leave the farm gate. We will start our look at the food sector with food retailers and away-from-home food firms. Subsequently, we will look at wholesaling firms, food manufacturers and processors, and assembly and transportation firms. We will end this section with a focus on the linkages across firms in the food sector, and between the food sector and the other sectors in the food production and marketing system.
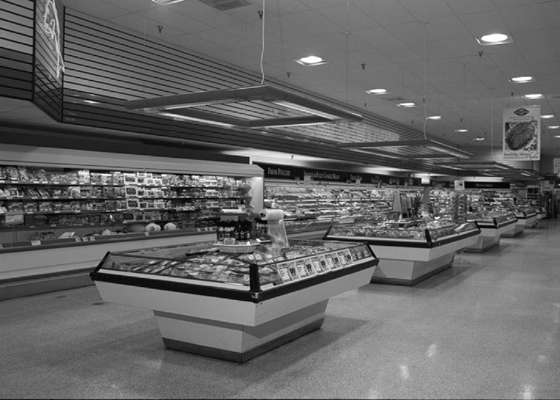
The food retailing sector accounts for 13.1 percent of the value added to the consumer food dollar (Figure 1.3). Food is no longer moved just through the typical supermarket because the food retailing sector has fragmented since the late 1980s. Food store formats are classified into three general categories: grocery stores, warehouse clubs and supercenters, or other food stores.
The grocery category includes traditional supermarkets, as well as convenience stores, superettes and small grocery stores, and specialty food stores (such as meat markets, fish markets, or bakeries). The category of warehouse clubs and supercenters was first dominated by warehouse stores such as BJ’s Wholesale Club or Costco. More recently, growth in this sector has been driven primarily by Walmart and Target. Other food stores include food retailed via mass merchandisers, drug store/combination stores, mail order, home-delivered food, and farmers’ markets. Key attributes for some of the most common store formats are briefly described (Elitzak, 2015):
• Supermarket: the conventional prototype typically carries about 15,000 items in a 10,000 to 25,000 square foot store.
• Superstore: has at least 40,000 square feet, which leads to a greater variety (25,000 items) of products, especially non-food items. The strategy is to promote the convenience of one-stop shopping, by providing additional service and selection.
• Convenience store (without gasoline): a small grocery store, selling a limited variety of basic foods, snack foods, and non-food products, typically with extended hours. Grocery products account for 45 percent of sales. Ready-to-eat and fountain beverages represent about 10 percent of sales. Packaged liquor, beer, and wine, and tobacco products account for another 35 percent of sales.
• Warehouse Club Stores: no-frills, membership-based, wholesale-retail hybrid outlets. These “box stores” serve both small businesses and individual consumers in a large warehouse-style environment. Grocery products (in large and multi-pack sizes) account for about 30 percent of sales. General merchandise (clothing, electronics, small appliances, and automotive products) accounts for 70 percent of sales. Following a low-price strategy, these stores typically stock fast-moving, non-perishable products, carrying 6,000 to 12,000 items in stores from 10,000 to 15,000 square feet.
• Supercenter: a large combination supermarket and discount general merchandise store, averaging 170,000 square feet of floor space. Grocery products account for up to 40 percent of floor space.
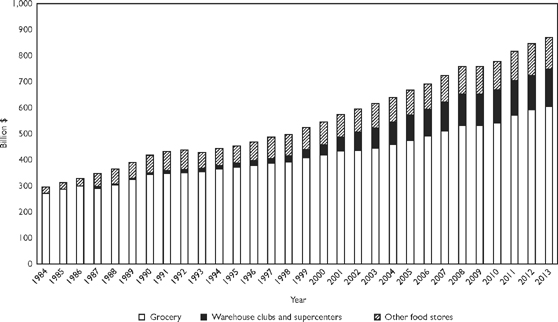
Total food store sales have climbed from $295 billion in 1984 to over $870 billion in 2013 (Figure 1.6). In 1984, grocery stores accounted for 93 percent of food sales, while warehouse clubs’ and supercenters’ sales were inconsequential. Since then sales at warehouse clubs and supercenters have steadily increased, accounting for 16 percent of food sales in 2013. This growth has largely come from an erosion of sales at supermarkets, whose market share of the food dollar for at-home consumption has fallen to 70 percent. Other food stores have accounted for roughly 14 percent of the market over time. They may be poised for growth as the local foods movement gains traction (Martinez, 2010).
A growing interest in local foods is the result of an increased interest in environmental and community concerns including supporting local farmers, the local economy, and increasing access to healthful food. Other reasons for buying local food include freshness and taste. Farm operations with direct-to-consumer sales increased from 116,733 to 144,530 between 2002 and 2012 (Low et al., 2015). Additionally, consumers are being offered more opportunities to purchase directly from producers through farmers’ markets, roadside stands, pick-your-own, on-farm stores, and community-supported agriculture arrangements. In 2014, there were 8,268 farmers’ markets operating, up 180 percent from 2006 (Low et al., 2015). It is estimated that in 2012, local food sales totaled $6.1 billion.

Plate 1.2 Farmers’ markets allow consumers to support their local economy and are a growing part of food retailing
Photo courtesy of K-State Research and Extension
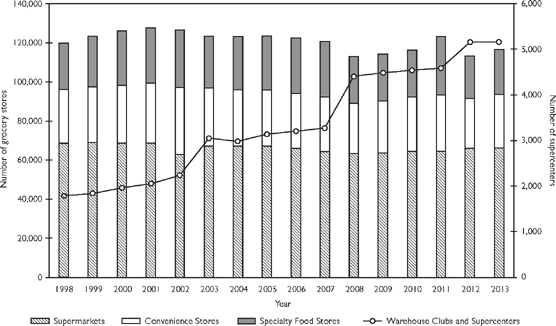
Since 1998, the total number of grocery stores has fallen 3 percent, to 66,286 stores in 2013 (Figure 1.7). The number of convenience stores and specialty stores has been relatively stable at around 25,000 stores each over this time frame. In contrast, the number of warehouse clubs and supercenters has almost tripled, from 1,788 to 5,162 stores, as consumers are drawn by the convenience of one-stop shopping and competitive prices.
The 1990s saw widespread consolidation in the grocery industry, as small “mom and pop” chains were acquired by or merged with larger grocers, who adapted to compete with the entry into food retailing by Walmart. This has resulted in fewer but larger food retailing firms. Table 1.3 identifies the ten largest chain stores in terms of total annual sales. Walmart has become the number one food retailer, followed by Kroger and Costco. This consolidation has led to a steady increase in industry concentration. From 1992 to 2013, the market share for the top four grocery firms more than doubled, from 17 to 36 percent, while the share for the top 20 firms climbed from 39 to 64 percent (Table 1.4). Concerns over increasing concentration led to a series of five hearings conducted by the Department of Justice and Agriculture in 2010 about antitrust enforcement (U.S. Department of Justice).
Food retailing remains an extremely competitive industry with little margin for error. Warehouse clubs and supercenters compete in part because of their supply chain management expertise. For example, Walmart is a leader in the adoption of information technologies such as radio frequency identification (RFID) or centralized checkout stands. All types of food retailers are increasingly looking to store or private label offerings. While some argue that fewer and larger retail food outlets will mean a more general selection offered by retailers, others insist that larger retailers can offer a broader assortment of more competitively priced products to customers. The industry is mature, and performance will be driven by disposable income, consumer tastes and preferences, and female participation in the workforce.
| Rank/Retailer | Number of food stores owned | U.S. food store sales (billion dollars) |
| 1. Wal-Mart Stores | 4,987 | 218.7 |
| 2. Kroger Co. | 3,369 | 108.5 |
| 3. Costco Wholesale Corp. | 664 | 91.5 |
| 4. Loblaw Cos. | 2,440 | 37.8 |
| 5. Safeway | 1,326 | 37.1 |
| 6. Publix | 1,090 | 30.6 |
| 7. Ahold USA | 766 | 23.7 |
| 8. Albertsons | 1,081 | 24.5 |
| 9. H-E-B | 363 | 22.6 |
| 10. CVS Health | 7,749 | 20.1 |
Source: Supermarket News 2015
The food services sector comprises the largest share of the 2013 food dollar, at 31.5 percent (Figure 1.3). The food service industry, which employs 11.1 million people, is comprised of three major types of firms—traditional restaurants, fast food/quick service restaurants, and institutional food service firms. The nation’s 526,000 restaurants hit $706 billion in sales in 2013, up from $291 billion in 1994 (Figure 1.8).
| Year | Top four firms’ % | Top eight firms’ % | Top 20 firms’ % |
| 1992 | 16.8 | 26.4 | 39.2 |
| 1993 | 16.8 | 26.5 | 39.9 |
| 1994 | 16.7 | 26.1 | 41.1 |
| 1995 | 17.1 | 27.3 | 40.6 |
| 1996 | 17.5 | 28.7 | 42.2 |
| 1997 | 19.0 | 31.3 | 45.9 |
| 1998 | 28.0 | 39.0 | 50.3 |
| 1999 | 27.6 | 39.9 | 54.0 |
| 2000 | 28.8 | 42.6 | 54.7 |
| 2001 | 31.9 | 46.8 | 58.7 |
| 2002 | 29.8 | 44.4 | 56.2 |
| 2003 | 32.9 | 47.4 | 58.8 |
| 2004 | 33.8 | 46.7 | 58.8 |
| 2005 | 35.5 | 49.0 | 61.6 |
| 2006 | 34.7 | 47.8 | 59.6 |
| 2007 | 37.5 | 50.4 | 63.7 |
| 2008 | 38.1 | 50.8 | 65.1 |
| 2009 | 37.9 | 50.9 | 64.3 |
| 2010 | 36.7 | 49.5 | 62.9 |
| 2011 | 36.2 | 49.2 | 62.2 |
| 2012 | 36.1 | 48.1 | 61.8 |
| 2013 | 36.4 | 48.1 | 63.8 |
Source: USDA, ERS calculations using data from U.S. Census Bureau, Monthly Retail Trade Survey, company annual reports, and industry sources. Sales based on North American Industry Classification System (NAICS)
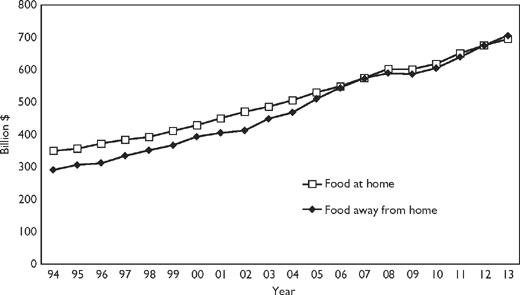
The food service industry has seen steady growth, especially from 1990 as busy people, dual-career families, and a more affluent, mobile society chose the luxury, or some would say the necessity, of eating more meals away from home. In 1960, only 26 percent of the food dollar was spent on food away from home (Figure 1.9). Since 2000, the proportion of the food dollar spent eating out and at home has been almost equal. The USDA predicts that by 2020, 52 percent of the food dollar will be spent on food away from home.
Traditional Restaurants. Traditional restaurants, also called full-service restaurants, saw sales of roughly $274 billion in 2013 (Clauson, 2014). Despite a slowdown in the general economy, affluent baby boomers are the most frequent customers at full-service restaurants. Reflecting a cultural change among Americans, eating out at full-service restaurants plays an important social function for today’s customers. Whereas 30 years ago socializing and entertaining were done at one’s home, today’s consumer meets family, friends, and co-workers at the local restaurant for leisure, conversation, and convenience. There is growing disparity among restaurant types. Substantial growth is expected for casual dining restaurants with per person checks in the range of $15–$20. These full-service restaurants may cater to families or those looking for a more relaxed dining experience. Cuisines at full-service restaurants have shifted towards Italian, Mexican, Japanese, Thai, Caribbean, and Middle Eastern foods, as U.S. tastes broaden.
Fast food/quick service. The words “fast” and “quick” not only describe the service provided by these restaurants, they also describe the rate at which this industry changes. Since 1990, fast-service food firms such as McDonald’s, Subway, and Taco Bell have almost tripled their sales, from $87 to $248 billion. Established as part of American culture, fast food restaurants have stepped into the next dimension of customer service by experimenting with the offerings and specials on their menus, and faster, better means of providing customers with both fast and nutritious foods. Rising concerns about obesity are leading to new menus. Today’s fast-food/quick-service restaurants often have central wholesale warehouses and buying offices, and many have expanded internationally as U.S. markets have become saturated.
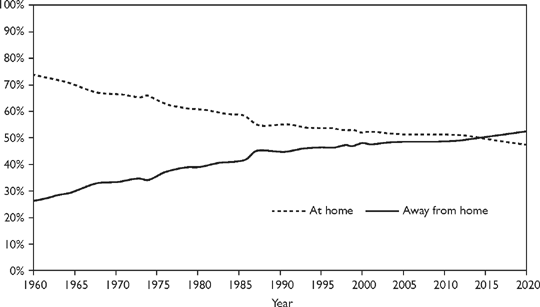
Figure 1.9 Percentage of sales of food at home and away from home, 1960–2020
Source: Westcott (2011)
Institutional food service. In 2013, over 41,800 firms were involved in institutional food marketing, with sales of $148 billion. This category includes food offered at hotels, schools, and colleges, government offices, corporate eating establishments, airlines, hospitals, etc. Institutional food services account for an important portion of the food people consume daily. Some types of institutional food service firms expanded rapidly during the 1990s (recreation and entertainment facilities, and retail hosts such as gas stations and bookstores), while sales through other firms in this category were stable or declined (hospitals, vending machines, and the military). Trends and changes in the institutional food service industry will continue to reflect consumer demands for convenience and nutrition. For instance, 30 years ago, it would have been unusual to see ethnic foods, something now considered common, on the menu of a major university’s dorm cafeteria.
In 2013, food wholesaling represented an $800 billion business conducted by 34,415 wholesalers employing almost 800,000 employees (County Business Patterns, 2015). While there are several ways to categorize the work done by wholesalers, three basic categories capture most firms in this industry. Merchant wholesalers represent the largest percentage of food wholesale sales, accounting for approximately 60 percent of the total. Merchant wholesalers primarily buy groceries and grocery products from processors or manufacturers, and then resell those to retailers, institutions, or other businesses. Manufacturers’ sales branches and offices (MSBOs) are wholesale outfits typically run by large grocery manufacturers or processors to market their own products. Wholesale agents and brokers are wholesale operators who buy and/or sell as representatives of others for a commission. Wholesale brokers and agents typically do not physically handle the products, nor do they actually take title to the goods.
Most wholesale operations focus on sales to retailers, other wholesalers, industrial users, and, in some cases, the final consumer. A wholesaler may buy directly from the producer and sell to another wholesaler or food processor. More typically, however, the wholesaler buys from the food processor or manufacturer and sells to a retailer. The make-up of the wholesale trade sector involves a large group of varied organizations—some quite small and some very large. Chain stores own their warehousing facilities, but typically break this out into a separate operating unit with the objective of generating a profit.
Wholesalers perform a variety of functions for their retail customers. It is important to note that wholesalers are facilitators and that they may take market risk if they take title to the goods they handle. These firms are responsible for distributing the product in appropriate quantities across a geographic region. Often wholesalers will finance inventory purchases for the retailer. In this case, the retailer does not have to borrow money from the bank, but uses the wholesaler as a source of operating funds. Many wholesalers offer services like automatic ordering, customer traffic surveys, and a suggested shelf-stocking arrangement, among others. The idea is for the wholesaler to forge a profitable working relationship with its retail clients.
Merchant grocery wholesalers are classified into three groups by the types of products they distribute: (1) general line distributors; (2) specialty distributors; and (3) miscellaneous distributors. First, general line distributors operate 9 percent of the total number of food wholesalers, but employ 18 percent of the wholesaler workforce (Wholesale Trade, 2015). Also known as broad line or full line distributors, these companies handle a complete line of groceries, health and beauty products, and household products. Supervalu and Sysco are examples of general line distributors. Second, specialty distributors are typically smaller than general line distributors, and focus on specific items such as packaged frozen food, dairy products, meat or fish products, confectionery, or fresh fruit and vegetables. Specialty wholesalers account for 50 percent of the food wholesaling establishments, employing 46 percent of the workforce. Finally, miscellaneous distributors carry narrow lines of dry groceries (coffee, snack foods, bread, or soft drinks), which are distributed directly to retail food stores. Accounting for 13,763 food wholesalers, miscellaneous food wholesalers employ 36 percent of the wholesale industries’ workers.
In 2011, U.S. food processors accounted for 14.7 percent of the value of shipments from all U.S. manufacturing plants (Martinez, 2014). Meat processing is the largest component of food manufacturing and accounted for 24 percent of food and beverage manufacturing shipments in 2011. The Annual Survey of Manufacturers from the U.S. Census Bureau counted almost 30,000 food-processing plants across the nation. An additional $153 billion of processing was performed by 4,347 beverage manufacturers, 92 tobacco manufacturers, 250 fiber, yarn, and thread mills, and 191 tanneries (2012 Economic Census, 2015).
The food processing and manufacturing industry turns raw agricultural commodities either into ingredients for further processing or final consumer products. Meat packers, bakers, flour millers, wet corn mills, breakfast cereal companies, brewers, snack firms, and tanneries are examples of food and fiber processors and manufacturers. These complex firms serve highly varied markets. For example, soybean processors in central Illinois break down soybeans into two major components—soybean oil and soybean meal—each with its own unique market conditions. Literally hundreds of products utilize soybean oil as an ingredient, ranging from margarine to cosmetics. The primary market for soybean meal is as a high-protein livestock feed supplement.
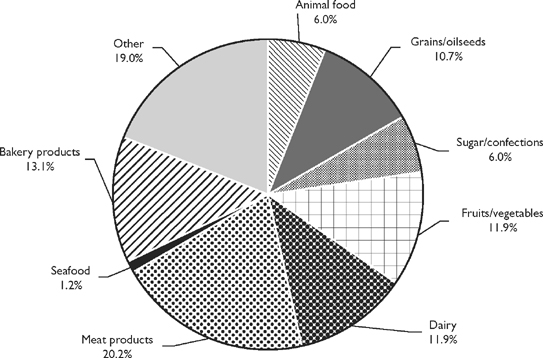
Processors of meat products account for about 20 percent of the total value added by food processors and manufacturers (Figure 1.10). Processors of baked goods, fruits and vegetables, dairy, and grains and oilseeds all account for more than 10 percent of total processing activity. While over 4,500 firms are engaged in food-processing activities, most own only a single processing plant. An earlier survey found 66 percent of all plants were small (0–19 employees) and accounted for only 4 percent of the total value of shipments, while large plants (100 or more employees) accounted for only 12 percent of plants but 77 percent of shipment value (Martinez, 2014).
The sharp increase in concentration among food-processing industry firms in the last 30 years has led to a few large companies marketing a wide variety of commodity and branded products. Major commodity-processing industries, such as animal feed, grain milling, and meat packing, are dominated by giants such as Smithfield Foods, Cargill, ADM, and ConAgra. Among well-known food processing and manufacturing firms are Nestles, Kraft, General Mills, Mars, and Coca-Cola.
Our final group of food sector firms includes those that acquire or assemble commodities from agricultural producers, and store and transport these products for food manufacturing and processing firms. Transportation and logistics firms facilitate the marketing and processing phases of the food sector. Firms ranging in size from the grain handling giant Cargill to local cooperatives that handle grain are involved in the collection, storage, and transportation of agricultural commodities. A similar process then ensues as products are shipped to food retailers.
Transportation output is measured in ton-miles, a metric which tracks the interrelationship between weight and distance. For example, if a 25-ton truckload of wheat moves 200 miles to market, that trip generates 5,000 ton-miles. Agricultural and food products are important users of the U.S. transportation system. Agricultural commodities shipped from growers to processors accounted for 11.8 percent of the ton-miles in 2012 (United States Department of Transportation, 2015). Shipments from food processors to retailers account for another 10.1 percent of the total ton-miles.
One example is the way that grain moves from farm to processor. Grain typically moves from the farm either to local elevators or to sub-terminal elevators located near transportation centers. These firms make money on grain movement, not on speculating that the grain they hold will go up in price. Small local grain elevators may sell to a larger sub-terminal or terminal elevator, or directly to a processor. Terminal elevators assemble grain from smaller country elevators to amass a quantity of grain that will fill unit trains or barges. Unit trains might move corn to the southeast to feed poultry. Or a group of barges might be transported down the Mississippi River and the delivered grain shipped to the international market.
Managing transportation and storage firms brings a unique set of challenges. A grain buyer for a terminal elevator located close to rail lines and a navigable river must be knowledgeable of rail rates, the availability of rail cars, and barge rates. Often these rates can change significantly overnight. Risk management is paramount, as commodity prices change quickly. Margins for these firms are typically razor-thin; hence, cost management is a priority.
Many of the organizations involved in the food sector have successfully integrated forward or backward in the food system. Goals for such a strategy include increased operating efficiency and reduced market risk. For example, many firms are involved in both processing and marketing activities and have at least partially integrated back to the production sector by entering partnering or contracting arrangements with producers. Smithfield Foods is one example of a firm with such a position in the market. The link helps reduce market risk by reducing material quality and supply problems.
This arrangement is common in the poultry, fruit, and vegetable production sectors. In the Midwest, for example, the Redenbacher Popcorn Company has producer agreements that guarantee supply before the crop is planted in the spring. Redenbacher contracts with producers by guaranteeing a specific price for popcorn grown on a specific number of acres. The firm provides seed and purchases all popcorn grown on the acreage under contract. Producers deliver production to a local processing facility.
Kroger, one of the top food retailers, owns 37 food processing plants that are used to manufacture store label products, including dairy, snack foods, and bakery items. Anheuser-Busch owns malting plants and can-manufacturing operations. Firms like ConAgra have a presence at almost every level of the food system. As mentioned earlier, such linkages are common and make the lines between industries very blurry, and the resulting firms quite complex.
At the hub of our food-production and marketing system is the production agriculture sector. Production agriculture includes the farms and ranches that produce the crop and livestock products that provide inputs to the food and fiber sector. These farms and ranches are the customers of the firms that make up the input supply sector. As mentioned earlier, relatively few individuals are responsible for a staggering quantity of output in the U.S. production agriculture sector. Today’s U.S. farmer produces enough food and fiber in a year to feed and clothe 155 people. More than 40 percent of the corn grown in the world is produced in the U.S.
Every industry in the food system is impacted in some way by production agriculture. And like the food and input supply sectors, the production agriculture sector has been undergoing profound change in response to a variety of market forces. In this section, we will explore the dynamic production agriculture sector of our food production and marketing system.
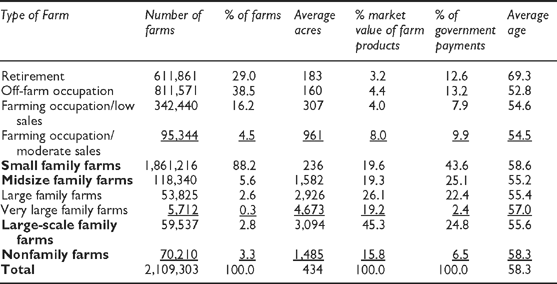
So what is a farm? The United States Department of Agriculture (USDA) defines a farm as “any place from which $1,000 or more of agricultural products were produced and sold, or normally would have been sold, during a given year” (2012 Census of Agriculture, 2014). This definition includes many part-time farmers with limited acreage and very modest production. The USDA definition of a farm includes the small hobby farmer that sells one horse or ten lambs per year as well as the commercial operator that farms 8,000 acres or produces 700,000 head of hogs annually. The definition includes those who farm part-time and those who have farmed full-time for generations. The Economic Research Service (ERS) of the USDA classifies farms into four groups: small family farms, midsize family farms, large-scale family farms, and nonfamily farms. Small family farms include retirement farms, off-farm occupation farms, and farm-occupation farms with both low sales (gross cash farm income less than $150,000) and moderate sales (gross cash farm income between $150,000 and $349,000). Midsize family farms include operators reporting farming as their primary occupation and gross sales between $350,000 and $999,999. Large-scale family farms are family farms with gross cash farm income over $1 million and are further broken down to large family farms and very large family farms who report gross cash farm income of $5 million or more. Nonfamily farms are any farm where the primary operator and his or her relatives do not own a majority of the business (2012 Census of Agriculture, 2014).
The make-up of the farms varies widely, depending upon the farm typology. Most farms (88.2 percent) are classified as small family farms, yet they produce 19.6 percent of the market value of farm products (Table 1.5). Midsize family farms make up 5.6 percent of all farms, producing 19.3 percent of farm production, large-scale family farms make up 2.8 percent of all farms while producing 45.3 percent of farm production, while nonfamily farms produce 15.8 percent of all farm products with only 3.3 percent of the farms. At 3,094 acres, large-scale family farms are almost twice the size of midsize family farms.
The past century was a period of huge change for production agriculture in the U.S. Changes in farm numbers and farm size are reflective of this change. Historically, individual families or extended families owned and operated the nation’s farms. The family provided the land, labor, and other capital necessary to run the business. As market prices fluctuated, farm families adapted by doing without or diversifying in some way. As mechanization or finances allowed, more land was acquired—ideally to send a child to college, or to provide a living for additional family members coming into the business.
As time moved on, farm expansion required additional inputs such as seed, fertilizer, chemicals, credit, animal health products, or farm machinery be purchased. Technology-fueled expansion made it possible for farmers to operate and productively manage ever-larger farm businesses, and farm size grew. However, when fluctuations in price or crop losses caused lean years, farmers still had obligations to pay suppliers. Financing became a necessary and critical component of the family farm business. As we will see later in this book, such debt financing also carries a risk.
Average land values over time reflect the economic health of the farm sector (Table 1.6). Land values grew from $196 to $737 per acre during the 1970s, as America planted from fence row to fence row to meet a surge in worldwide demand. In turn, farm expansion financed by debt and secured through the inflated land values of the 1970s created severe financial problems for some producers, as well as their suppliers. Some of these farms were not able to survive the farm crisis of the 1980s and farm foreclosures contributed to an overall decline in farm numbers. Thus, the 1980s saw a retreat in farm land values. Farm land values have steadily increased since 1990, as production agriculture has seen a resurgence driven by strong growth in biofuels and export markets.
| Year | Farms | Land in farms (1,000 acres) | Average size (acres) | Average farm land value ($/acre) |
| 1970 | 2,949,140 | 1,102,371 | 373.8 | 196 |
| 1975 | 2,521,420 | 1,059,420 | 420.2 | 340 |
| 1980 | 2,439,510 | 1,038,885 | 425.9 | 737 |
| 1985 | 2,292,530 | 1,012,073 | 441.5 | 713 |
| 1990 | 2,145,820 | 986,850 | 459.9 | 683 |
| 1995 | 2,196,400 | 962,515 | 438.2 | 844 |
| 2000 | 2,166,780 | 945,080 | 436.2 | 1,090 |
| 2005 | 2,098,690 | 927,940 | 442.2 | 1,610 |
| 2006 | 2,088,790 | 925,790 | 443.2 | 1,830 |
| 2007 | 2,204,950 | 921,460 | 417.9 | 2,010 |
| 2008 | 2,184,500 | 918,600 | 420.5 | 2,170 |
| 2009 | 2,169,660 | 917,590 | 422.9 | 2,090 |
| 2010 | 2,149,520 | 915,660 | 426.0 | 2,150 |
| 2011 | 2,131,240 | 914,420 | 429.1 | 2,300 |
| 2012 | 2,109,810 | 914,600 | 433.5 | 2,520 |
Source: Morehart 2015 and U.S. Department of Agriculture 2014.
Total land in farms in the U.S. continues to decline slowly, due in part to conservation programs, as well as continued development of housing tracts, malls, and factories (Table 1.6). In 2012, a total of 915 million acres was farmed, down from its peak of 1.2 billion acres in 1954. The number of farms and ranches in the U.S. (2.1 million in 2012) has been relatively stable since 1990. Texas reports the most farms in the U.S. with 248,809; Missouri is in second with 99,171 farms.
Larger and more specialized farming operations have evolved since the 1930s. As a result, a much smaller group of producers accounts for the majority of agricultural production. The 2012 Census of Agriculture showed that about 95 percent of all agricultural production came from 19 percent of U.S. farms, and 80 percent of the total came from only 7 percent of the farms—about 155,000 farmers (Figure 1.11).
Despite all of the changes, today families or family businesses still own nearly 97 percent of the nation’s farms (Table 1.5). However, it is important to note that many of these family-run farming operations are very large and sophisticated businesses. At the same time, nonfamily owned corporate farms, particularly in the livestock and poultry industries, are increasing in number. In 2012, such operations accounted for 15.8 percent of total farm sales.
Net farm income in the U.S. is determined by prices of farm products, production yields, and farm production expenses. Farm prices can be highly volatile, moving upward quickly in response to low tomato yields, or plunging if the market doesn’t need all of the pork produced by U.S. producers. Note that the commodity nature of most agricultural markets means that individual farmers have little control over the price of their production. They can take steps to manage their price risk, but they cannot do much about the actual price they receive. Production expenses can also be volatile. Fuel costs can soar when general market supplies are short. The price of nitrogen fertilizer, which is made from natural gas, can increase very quickly if natural gas is in short supply.
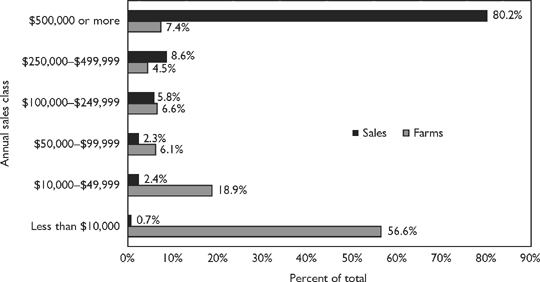
Figure 1.11 Distribution of farm sales by sales class, 2012
Source: 2012 Census of Agriculture (2014)
Given the importance of the production agriculture sector, it has been the policy of the U.S. government since the 1930s to support the income of farmers when market conditions are not favorable. There are a wide variety of such programs that assist farmers, and these vary by commodity. Some crop and livestock products, such as peanuts, wheat, and dairy products, have substantial government involvement. Other crop and livestock products such as soybeans, pork, and lettuce have much lower levels of government involvement. When combined across all crops, total payments from the government have been an important, but declining, component of net farm income in the U.S. (Table 1.7). Government payments have been especially important for small family farms (Table 1.5).
The production agriculture sector continues to evolve. Consolidation in the sector has been rapid to date, and farms are getting larger every year—especially in the livestock sector. International competition, volatile input prices, environmental and food safety regulations, and rapid deployment of new technology have all placed substantial pressure on the owner/manager of a production agriculture business. Agricultural producers have responded to these pressures with an increased emphasis on financial and risk management; a focus on control of assets like land and machinery as opposed to ownership; and the general application of many of the management ideas we will address in this book. For many years people talked about farming as “a way of life.” While the “way of life” aspect remains important to many producers, successful commercial agricultural producers in today’s business environment are astute, sophisticated business managers running large and complex organizations.
| Year | Net Income (millions $) |
Government Payments (millions $) |
Payments as % of Farm Income |
| 1970 | 14,365.9 | 3,717.4 | 25.9 |
| 1975 | 25,510.2 | 807.1 | 3.2 |
| 1980 | 16,141.4 | 1,285.7 | 8.0 |
| 1985 | 28,509.3 | 7,704.2 | 27.0 |
| 1990 | 46,260.7 | 9,298.0 | 20.1 |
| 1995 | 39,770.8 | 7,279.5 | 18.3 |
| 2000 | 50,684.9 | 23,221.6 | 45.8 |
| 2005 | 78,763.0 | 24,395.9 | 31.0 |
| 2006 | 57,436.4 | 15,788.8 | 27.5 |
| 2007 | 70,323.0 | 11,903.4 | 16.9 |
| 2008 | 86,597.6 | 12,241.7 | 14.1 |
| 2009 | 62,187.1 | 12,262.6 | 19.7 |
| 2010 | 98,901.2 | 12,391.3 | 12.5 |
| 2011 | 113,912.9 | 10,420.5 | 9.1 |
| 2012 | 93,605.5 | 10,635.1 | 11.4 |
| 2013 | 123,289.4 | 11,003.8 | 8.9 |
Source: Morehart 2015.
The input supply sector of the food production and marketing system is comprised of the firms that manufacture and distribute the myriad of inputs used by the production agriculture sector. The agricultural input industry umbrella is a broad one and includes a wide range of firms that provide products and services to agricultural producers. Animal nutrition, seed, machinery and equipment, fertilizer, crop protection, and credit and banking firms would be among the enterprises which fall under the general category of input suppliers.
A description of just what these industries look like today only vaguely resembles their appearance just a few years ago. During the last 40 years, these industries, like the food and production agriculture sectors, have experienced vast and dynamic change. Taking a quick look at the history book helps define today’s agricultural input business. A rapidly growing agriculture fueled a prosperous input supply sector in the 1970s. The massive adjustments of the production sector in the 1980s brought an equally huge reorganization of the input supply industries. Since the 1990s, continued consolidation in the livestock sector has reshaped the input supply industries serving animal agriculture. Consolidation in the agronomic industries via mergers and acquisitions has led to fewer, larger players at both the manufacturing and the distribution levels.
The productivity of the agricultural production sector continues to increase, in no small part due to the products and services provided by the input supply sector. Improved varieties of seed may be attributed to advances in biotechnology among other more conventional developments, which allow improved and lower-cost production methods. Animal nutrition, farm machinery and equipment, agricultural pesticides and herbicides, and the many facilitating services offered to producers help increase the productivity of the production agriculture sector. Information technologies such as global positioning and monitoring systems have seen widespread adoption. For the purpose of this text, we have categorized the farm input supply sector into three areas:
• Distribution
• Services
We will explore each of these three areas in the remainder of this section.
Manufacturers in the input supply sector include many company names you may well recognize. John Deere, Syngenta, Zoetis, and Monsanto are just a handful of examples of large organizations that spend millions of dollars annually in research and development to bring improved products to the producer. Virtually everything it takes to run the farm or ranch must be purchased from an input supplier of some sort. Farmers purchase over 75 percent of all inputs used for production. In 2013, farm production expenditures were $356.0 billion (Table 1.8). On average, a U.S. farmer spends about $165,500 per year to run the farm business and these expenses for farmers represent the sales of the input supply sector (Morehart, 2015). Input manufacturers are responsible for the research, development, production, and manufacturing that makes these products possible.
Livestock and poultry products include feed, feed supplements, and health products which are required in the production of meat, milk, and fiber products such as wool. Providing producers with products such as these requires access to and use of high technology, often large manufacturing plants, and a sizable research and development budget to support efforts of this scale. In addition to products that feed animals and keep them healthy, other input firms manufacture products for housing livestock, storing and managing livestock waste, and moving livestock from farm to market.
| Item | 2010 | 2011 | 2012 | 2013 |
| Farm Origin Inputs | 82.1 | 96.1 | 106.2 | 109.8 |
| Purchased Feed | 45.4 | 54.6 | 60.5 | 62.4 |
| Livestock Purchased | 20.4 | 23.7 | 24.8 | 25.5 |
| Purchased Seed | 16.3 | 17.8 | 20.9 | 21.9 |
| Manufactured Inputs | 50.1 | 58.0 | 64.8 | 65.7 |
| Fertilizer and Lime | 21.0 | 25.1 | 28.9 | 28.3 |
| Pesticides | 10.7 | 11.8 | 14.0 | 14.6 |
| Fuels & Oils | 13.8 | 16.2 | 16.5 | 17.3 |
| Electricity | 4.6 | 4.9 | 5.4 | 5.5 |
| Total Interest Charges | 15.1 | 14.6 | 15.8 | 14.0 |
| Other Operating Expenses | 81.9 | 85.7 | 96.0 | 94.1 |
| Repair and Maintenance | 13.4 | 14.0 | 15.5 | 16.1 |
| Contract and Hired Labor | 26.9 | 26.4 | 31.6 | 31.8 |
| Machine Hire and Custom Work | 4.3 | 4.0 | 4.9 | 4.5 |
| Marketing, Storage and Transportation | 9.0 | 9.0 | 9.2 | 8.0 |
| Miscellaneous Operating Expenses | 28.3 | 32.3 | 34.8 | 33.7 |
| Overhead Expenses | 45.2 | 47.0 | 66.2 | 72.4 |
| Depreciation | 17.1 | 17.9 | 33.1 | 36.5 |
| Property Taxes | 10.5 | 11.0 | 11.3 | 11.6 |
| Rent | 17.6 | 18.1 | 21.8 | 24.3 |
| Total Production Expenses | 274.4 | 301.4 | 349.0 | 356.0 |
Source: Morehart 2015.
Trucks, tractors, and combines are all examples of manufactured products supplied to farmers through the input supply sector. Deere & Company is one of the oldest firms in the U.S. and is a Fortune 500 company with net sales and revenues of $37.8 billion in 2013. Focused on bringing new and better products to the world’s farmers, Deere invests almost $1.5 billion in research and development annually.
At first glance, the seed industry may not seem like it is an input manufacturing industry. However, seed firms annually invest millions of dollars in developing and producing or “manufacturing” hundreds of new hybrids and varieties of seed. Chemical companies such as Syngenta and DuPont produce crop protectants that reduce weed and insect pressure, or protect the crop from disease. Recent developments in biotechnology have led to many products that bring these two industries together. Some crops have been modified to resist certain pests. Other crops have been modified to resist a particular herbicide, making weed control much easier. These crops have not been without controversy, and broader market acceptance of these genetically modified organisms (GMOs) has evolved slowly outside the U.S.

Plate 1.3 Input suppliers contribute to overall production efficiency through continued advances in technology
Photo courtesy of K-State Research and Extension
Farm production inputs move from the manufacturer to the farm through a very wide variety of sales, marketing, and distribution channels. Using the technology developed by manufacturers also requires accurate and timely technical information, as well as timely access to the products. This is the job of input distributors—individuals, companies, outlets of national organizations, cooperatives, e-businesses, etc.—responsible for getting the products from the manufacturer to the farm, and providing a set of services that insure productive use of the inputs.
These distribution firms represent a very wide range of organizations. Sometimes, a major national manufacturer owns the distribution firm. Memphis-based Helena Chemical Company is an international company producing fertilizers, spray adjuvants, and specialty products. Helena reaches farmers through its retail and wholesale locations throughout the U.S. In other cases, the distributor is a franchise of a manufacturer. The local dealer network of John Deere provides a good example. In still other cases, the distribution network is independent of the manufacturing sector.
Local agricultural cooperatives are heavily involved in the distribution of inputs. A cooperative is a member-owned, democratically controlled business from which the benefits are received in proportion to use. Local farmers who are cooperative members buy and sell products through the cooperative and thus the cooperative is a distributor of agricultural products and/or services.
Stores or chains that offer everything from pet food to tractor parts operate as a retail business from which producers make purchases. Tractor Supply provides a good example. Given the very wide range of inputs that farmers use in their businesses, and given the equally wide range of farmers involved in production agriculture, it comes as little surprise that the distribution system involves such a wide range of organizations.
The agricultural services and financing area includes farm management services, veterinary care, consulting businesses, and farm lending, just to name a few of the types of businesses involved in this area. Larger farms and fewer farmers, combined with increases in absentee land ownership, have greatly contributed to an increase in the number of farm management firms and services offered in the last decade. Frequently, farm management services are hired to oversee land rental, crop production, and financial and tax management for the absentee landlord.
Financing the production agriculture sector is big business. In 2013, the farm production sector controlled about $2.9 trillion of total assets—all those resources of value involved in farming. At the same time, total farm debt amounted to $308.2 billion (Morehart, 2015). This debt includes debt on farmland and machinery, equipment, buildings, as well as production loans. Countless banks offer agricultural loans and related services to farmers.
The Farm Credit System serves as a lender to the farm sector providing production and farm real estate loans. In 2013, the Farm Credit System had loaned a total of $130.9 billion with roughly 66 percent being in long-term real estate loans. The Farm Credit System has provided approximately 40 percent of the total debt capital needed by the farm production system for farmland and operating funds in recent years. Other agricultural lenders include commercial banks and non-traditional lenders such as the captive finance companies of other input organizations.
Managing in this diverse, multi-faceted field of agribusiness requires a wide range of skills and talents. In addition to a strong background in management, agribusiness managers need a deep understanding of the biological and institutional factors surrounding the production of food and fiber. In the first section of this book, we will look more closely at the tasks of management and some key economic concepts that are important to managers. Then we will turn our attention to the types of organizations we find in the food and agribusiness markets, and explore some elements of the context within which agribusiness managers make decisions.
With this broader perspective in hand, we turn our attention to a deeper look at the four functional areas of management. First, we explore the area of marketing and sales. Subsequently, we will consider the management of the financial resources of the agribusiness. The final two sections deal with the important areas of supply chain management and human resource management. It is our goal that this book will provide you with a solid foundation for your further study—and practice—of agribusiness management.
The food production and marketing system is a complex, dynamic, and extremely productive part of the total U.S. economy. The study of agribusiness includes understanding basic management principles and practices. Four key functions of management are marketing, finance, supply chain management, and human resources management. An understanding of these functional areas is critical to the successful agribusiness manager.
There are a number of factors that combine to create a unique business environment for firms and managers in the food production and marketing system. This system is a highly efficient one. Over time, consumers have demanded more and more services with their food products. As a result, the proportion of the food dollar that goes to production agriculture has declined, and the marketing bill has expanded.
The definition of agribusiness used in this book includes three important sectors: the food sector, the production agriculture sector, and the input supply sector. In their combined activities, these three areas provide a tremendous variety of food and fiber products to consumers both in the U.S. and around the world. In this food system, each sector is tied to the next in the task of developing, producing, and delivering food products to the consumer. The food sector includes a wide range of firms including processors, manufacturers, wholesalers, and retailers. Many of these firms are global firms offering brands we are all familiar with. Others are focused on manufacturing ingredients that are inputs for other food companies. The production agriculture sector is undergoing dramatic change as the number of farms declines, and their size increases. Finally, the input supply sector provides the product and service inputs required by the farm production sector. Tractors, seed, crop protection products, capital, and advice are examples of products/services provided by input supply firms.
1. List and define the four functions of agribusiness management.
2. What are five reasons the agribusiness sector may be considered unique? How or why could agribusinesses and firms outside the agribusiness sectors make different decisions in similar situations?
3. In 2013, American consumers spent over $1 trillion on food for at-home and away-from-home consumption. While the marketing share percentage of the farm-food marketing bill has stayed relatively the same over the years, the dollar amount has increased from $441 billion to $852 billion from 1993 to 2013. What is included in the marketing share of the farm-food marketing bill? How does the marketing bill affect consumers? How does the marketing bill affect farmers?
4. One significant trend facing food retailers is the growing interest in local foods. Interpret this trend. Do you expect this trend to continue? Why or why not?
5. Larger and more specialized farming operations have evolved. What are the positive dimensions of this trend? What are the negative dimensions of this trend? How does this trend impact the food sector and the input supply sector?
6. The U.S. agriculture sector is incredibly efficient. What are some of the reasons for this efficient and effective food production and marketing system? What social issues and implications of the issues do you see for firms working in this sector?
In this chapter, we look at three key sectors of the food production and marketing system—the food sector, the production agriculture sector, and the input supply sector. For this case study, pick a specific food or fiber product you have an interest in. Then, using the library or the Internet, locate the name of one firm for each of the three sectors of agribusiness that is involved in some way in the production and distribution of your product. For example, if you choose burritos, this might be Chipotle (food sector), a family-owned pepper grower (production agriculture), and Farm Credit System (input supply sector). After you have identified your three companies, answer each of the questions below:
1. Briefly describe each of your firms. What markets do they serve? How large are the firms? What products do they produce?
2. How are these firms linked to the product you chose to research?
3. What is similar about the firms you chose? What is different about the firms you chose?
4. How are these firms related in the production and distribution of your product? Is this an explicit link (do they share the same parent company, for instance), or are they loosely related through open markets?
2012 Census of Agriculture. 2014. United States Summary and State Data. U.S. Department of Agriculture. AC-12-A-51. http://www.agcensus.usda.gov/Publications/2012/Full_Report/Volume_1,_Chapter_1_US/usv1.pdf
2012 Economic Census. 2015. U.S. Census Bureau. http://www.census.gov/econ/census/data/
Canning, Patrick. 2015. Food Dollar Series. U. S. Department of Agriculture, Economic Research Service. http://www.ers.usda.gov/data-products/food-dollar-series.aspx
Central Intelligence Agency. 2015. “The World Factbook.” https://www.cia.gov/library/publications/the-world-factbook/index.html
Clauson, Annette. 2014. “Food Expenditures.” U. S. Department of Agriculture, Economic Research Service. http://www.ers.usda.gov/data-products/food-expenditures.aspx
County Business Patterns. 2015. U.S. Census Bureau. http://www.census.gov/econ/cbp/
Elitzak, Howard. 2015. “Retail Trends.” U. S. Department of Agriculture, Economic Research Service. http://www.ers.usda.gov/topics/food-markets-prices/retailing-wholesaling/retail-trends.aspx
Food and Agriculture Organization of the United Nations. 2015. World Programme for the Census of Agriculture, WCA 2010 Round (2006–2015). United Nations, Rome, Italy. http://www.fao.org/economic/ess/ess_wca/en/
Low, Sarah, Aaron Adalja, Elizabeth Beaulieu, Nigel Key, Steve Martinez, Alex Melton, Agnes Perez, Katherine Ralston, Hayden Stewart, Shellye Suttles, Stephen Vogel, and Becca Jablonski. 2015. “Trends in the U.S. Local and Regional Food Systems: A Report to Congress.” U.S. Department of Agriculture, Economic Research Service. http://www.ers.usda.gov/publications/ap-administrative-publication/ap-068.aspx
Martinez, Stephen. 2010. “Varied Interests Drive Growing Popularity of Local Foods.” Amber Waves. U. S. Department of Agriculture, Economic Research Service. http://www.ers.usda.gov/amber-waves/2010-december/varied-interests-drive-growing-popularity-of-local-foods.aspx#.VVz3AvlVhBc
Martinez, Stephen. 2014. “Food and Beverage Manufacturing.” U.S. Department of Agriculture, Economic Research Service. http://www.ers.usda.gov/topics/food-markets-prices/processing-marketing/manufacturing.aspx
Morehart, Mitch. 2015. “Assets, Debt, and Wealth.” U. S. Department of Agriculture, Economic Research Service. http://www.ers.usda.gov/topics/farm-economy/farm-sector-income-finances/assets,-debt,-and-wealth.aspx
Supermarket News. 2015. “SN’s 2014 Top 75.” http://supermarketnews.com/2014-top-75-clickable-list
U.S. Department of Agriculture. 2014. “Farms and Land in Farms.” USDA, National Agricultural Statistics Service, Statistical Bulletin Number 1030. http://usda.mannlib.cornell.edu/usda/nass/SB991/sb1030.pdf.
U.S. Department of Commerce. 2015. “Gross-Domestic-Product-(GDP)-by-Industry Data.” Bureau of Economic Analysis, Washington, DC. www.bea.gov/industry/gdpbyind_data.htm
U.S. Department of Justice. 2011. Agriculture and Antitrust Enforcement Issues in Our 21st Century Economy. www.justice.gov/atr/public/workshops/ag2010/index.html#overview
U.S. Department of Transportation. 2015. 2012 Commodity Flow Survey. http://www.census.gov/econ/cfs/2012/ec12tcf-us.pdf
Westcott, Paul. 2011. “USDA Agricultural Projections to 2020.” U. S. Department of Agriculture, Economic Research Service. OCE-2011-1. http://www.ers.usda.gov/media/498867/oce111_1_.doc
Wholesale Trade. 2015. U.S. Census Bureau. www.census.gov/econ/wholesale.html